
2026 Market Outlook
Welcome to the FVEr Invest Blog: Your Guide to Data-Driven Market Analysis
Happy New Year FVEr Invest Subscribers!
Thank you to our new and continuing subscribers for your support of our platform. Our goal is to bring you frequent market insights, using our proprietary FVE algorithm to help you gain a clearer understanding of market dynamics.
2026 Outlook Summary
As we kick off 2026, the FVEr Invest model suggests a year of moderate price growth in US equities, alongside caution regarding overvaluation in international markets. While Wall Street consensus remains aggressively bullish, our data indicates a more tempered, defensive path forward. Our model does not currently see an imminent AI bubble risk for technology-centric ETFs, and we expect those parts of the market to continue performing moderately, albeit with less "high-octane" momentum than the last few years.
Our 4 best ideas for ETFs in 2026 that provide market variety are:
QQQ (Invesco Nasdaq 100)
IJR (iShares Smallcap 600)
XLP (SPDR S&P 500 Consumer Staples)
XLV (SPDR S&P 500 Healthcare)
For those looking for more detail, read on…
2026 S&P 500 Price Target
At the end of every year, the major investment houses release a year end target for the subsequent year for the S&P 500 Index. We added the FVEr Invest price target to this compilation of price targets, which was aggregated in the below linked article by Yahoo Finance, but we changed the start date to the close on December 26, 2025 which was the last Friday that the FVE model ran in 2025:
https://finance.yahoo.com/news/traders-discussing-markets-170711079.html
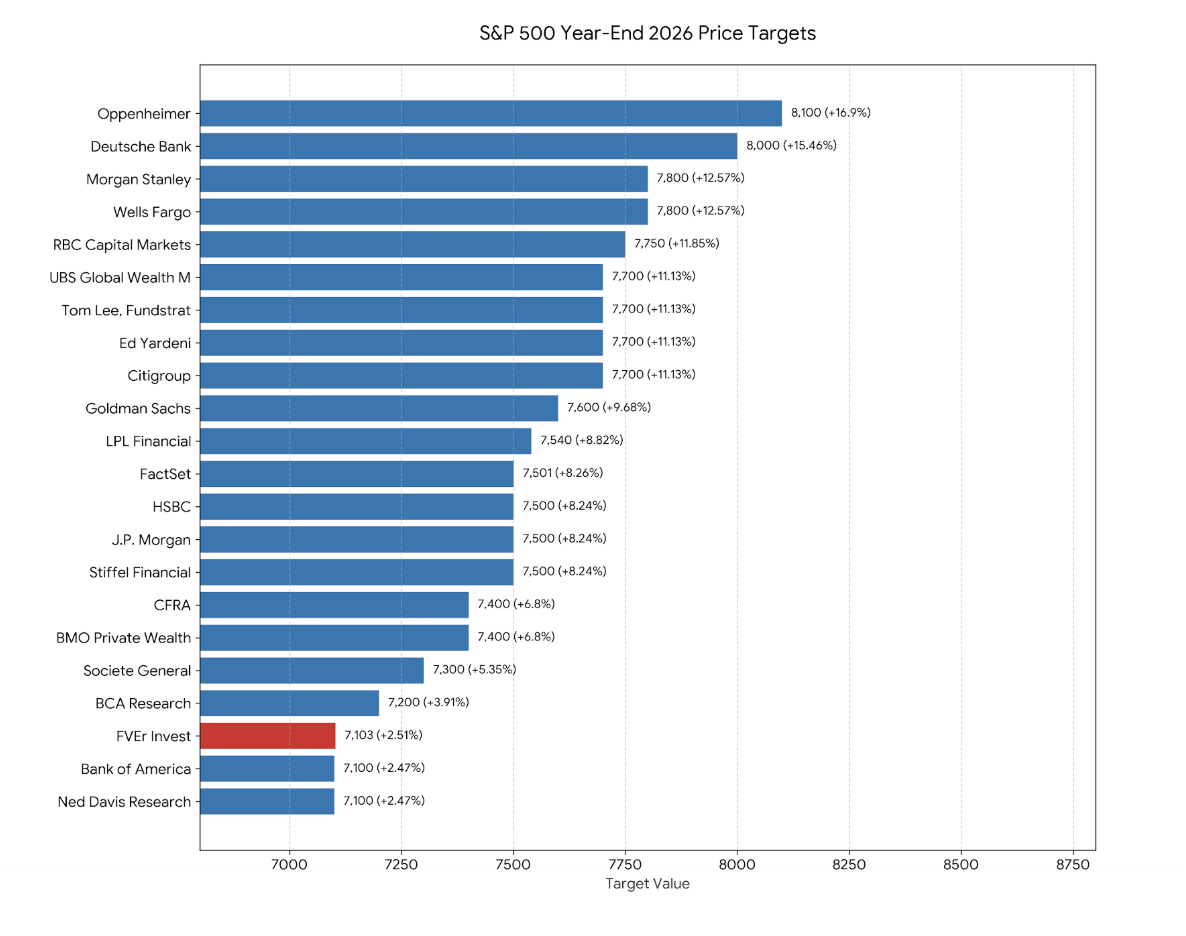
Our price target, which is in line with Bank of America and Ned Davis Research, is the third lowest, near the 7100 mark. As we have said recently, our model believes the US large cap stock market is expensive right now. If the S&P 500 hits the highest price target of $8,100 by Oppenheimer, that would put the index around 14% above the FVE by year end, which is in the 1 star range almost 2 standard deviations above the FVE. We think this scenario is unlikely, unless there is an AI driven investment frenzy that causes temporary price appreciation similar to the dot com boom then bust era. Currently, that does not seem to be happening after a cooling off period in the AI names in the fourth quarter.
Anything in the range 6800 to 7400 is what our model would deem fairly valued at year end 2026. Thus, we think most investment firms are considerably over optimistic going into 2026. As a reminder, the SPY ETF which tracks the S&P 500 Index is currently in 2 star territory, and is around 9% above its FVE. It has remained in this elevated valuation range for over 6 months. That is unlikely to continue for another year.
Other Areas of the Market
Broadening the scope of our analysis, the chart below details the year-end 2026 price targets for various US market ETFs tracked by our strategy.
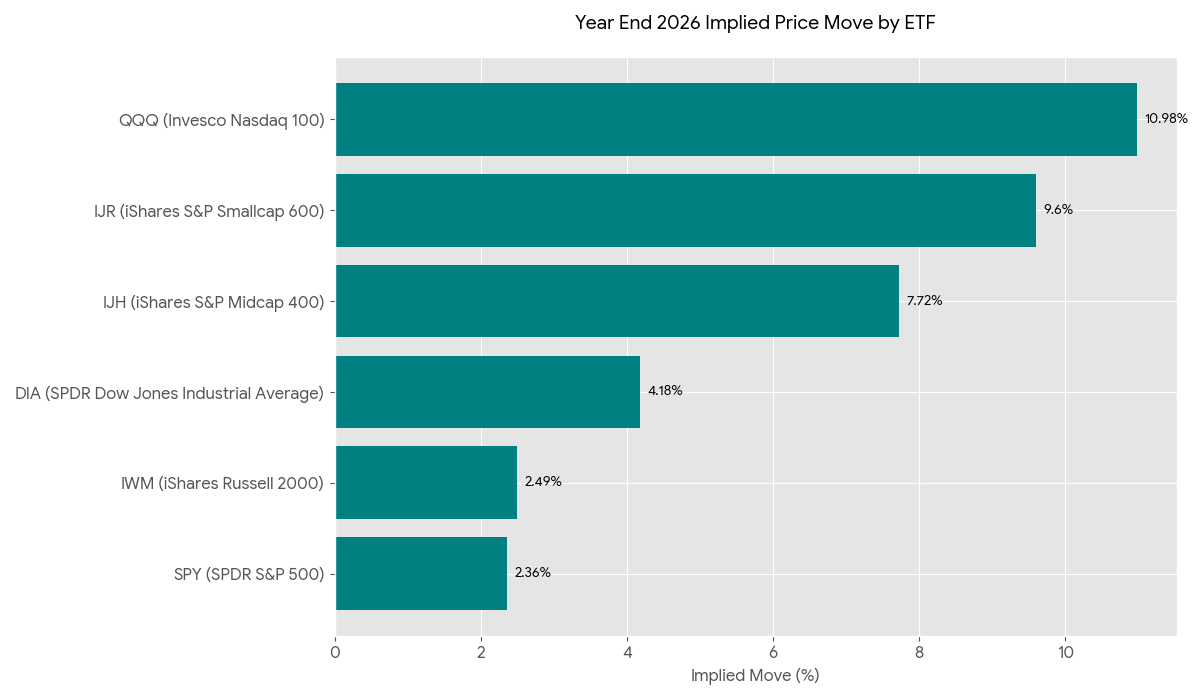
A couple interesting notes:
IWM (iShares Russell 2000) is up 12.59% over the trailing year, whereas IJR (iShares S&P Smallcap 600) is up only 5.34%, a noticeable divergence. The S&P Smallcap 600 has more restrictive qualifying criteria including a profitability requirement, compared to the Russell 2000. Unprofitable companies often carry more variable-rate debt and rely on future growth. As the Federal Reserve shifted toward a rate-cutting cycle in late 2025, these "low-quality" stocks benefited disproportionately from the anticipation of lower borrowing costs – thus producing an outperformance of IWM. Surprisingly, over the short term, it hurt investors who were choosing IJR, because of its tilt for higher quality stocks. Also, IWM has 6% more exposure to healthcare than IJR, including exposure to pre-revenue biotech stocks, which had a significant resurgence in 2025. With the majority of near term rate cuts in the rear view mirror, our model sees a return to quality small cap stocks, with IJR outperforming in 2026 up 9.6%, compared to IWM up only 2.49%.
The QQQ Nasdaq 100 is leading the way with an implied move of around 11% in 2026. Part of this is because our algorithm dynamically changes its future growth rate based on recent year performance, which has been stellar for the technology focused QQQ, and also because performance of the QQQ has leveled off for the last few months, which leads to more potential upside in the future.
The year-end 2026 outlook for SPY (SPDR S&P 500 ETF) is likely being weighed down by subdued price appreciation outlooks for the Industrials, Financials, Utilities, Real Estate, and Energy sectors, which combined account for about 25% of the index.
International stocks continue to be the most over-valued part of the global stock market according to our FVE. However, the inconsistency of international indices over the last two decades makes us have less conviction of our model in this area. Nevertheless, we see a downward move of 6.5% in VXUS (Vanguard Total International Stock ETF). Thus we recommend staying in the US for the time being.
By Sector
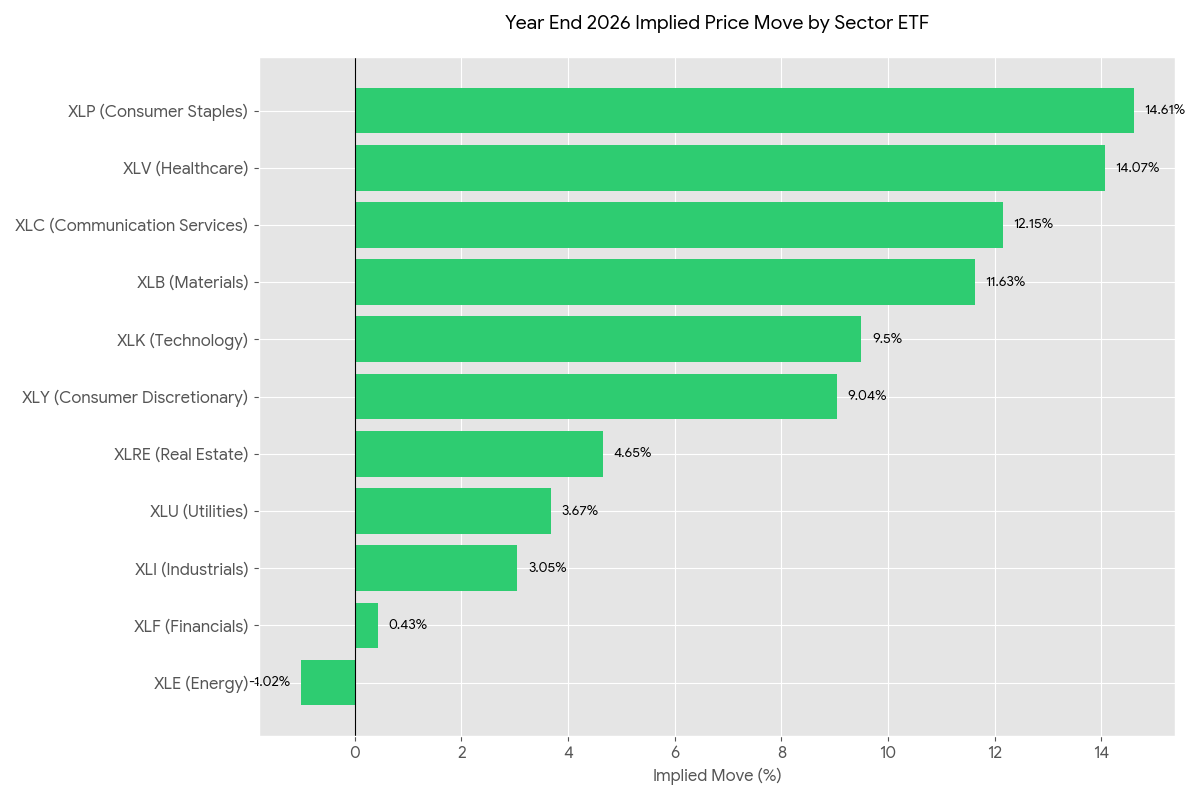
Here is what our FVE sees at the S&P 500 sector level. As you recall the S&P is partitioned into 11 different sectors. ETFs from State Street SPDR track each sector.
2026 Likely Leaders:
XLP (Consumer Staples): +14.61%
Defensive catch-up
Slowing economic growth favors this sector
Lower interest rates reduce the appeal of treasury bonds and increase the appetite for high dividend stocks which are common in this sector.
Rebound in Costco (COST) which accounts for 10% weighting in XLP, and is down 20% from its recent high
XLV (Healthcare): +14.07%
Continued resurgence of biotech after years-long post Covid slump
Aging demographics
Weight loss drugs continue to buoy growth
Better than feared tariff outlook
2026 Likely Laggards:
XLI (Industrials): +3.05%
Expectations for a massive industrial expansion from the AI buildout pulled forward prices in this sector in 2025 (up 20% in the last year), so there is less room for growth
XLF (Financials): +0.43%
While rate cuts help small caps, they can squeeze the Net Interest Margins (NIM) of large banks. When interest rates fall (as they did in late 2025), banks typically have to lower the rates they charge on new loans immediately. However, there is often a lag on lowering the rates they pay on deposits, which leads to lower near term profit margins.
XLE (Energy): -1.02%
We have lower conviction on our model applied to this sector because it doesn’t display the same consistent exponential growth trajectory of the other sectors, given that it is a proxy for energy prices which can behave like step functions. With that said, here are the risks:
Forecasted surplus of nearly 3.8 million barrels per day in 2026. This is roughly 4% of total global demand—one of the largest oversupply conditions in recent history.
Continued aggressive electrification in China lowers demand.
Importantly, if we take the weighted average projections of these sectors based on their market cap weights in the S&P 500, we get a projected performance of 8.33% for the S&P 500 over the next year, which is significantly higher than if we run the FVE on the price of the aggregate S&P 500. This variation is notable, and warrants a comment. When the FVE is run on a particular sector, the exponential trajectories and optimization steps are unique to the historical price action of only that sector, which can create a different aggregate projection for the S&P 500, compared to running the FVE on the price on the index as a whole. We like to think of these projections as ranges rather than exact numbers, so it seems reasonable that the S&P 500 will grow in the mid single digits range in 2026, taking into account both of these ways to model the projection. Not a big up year, but probably not a big down year either. After a rollercoaster in the markets since the outbreak of Covid in March 2020, we may see one of the quieter years so far this decade.
📈 FVEr Weekly Market Update: Monday January 5, 2026
News broke over the weekend of the military operation in Venezuela to remove sitting leader Nicolas Maduro. The writing of this blog is before market open on Monday, and thus it will be interesting to see how the market reacts to this significant geopolitical development, particularly the Energy sector.
For the strategy, this is the quietest week since we started live trading last year, with only XLP (Consumer Staples) being in leverage this week.
See you next time. In the meantime, please don't hesitate to reach out if you have any questions.
The FVEr Team
Unlock Deeper Insights: Schedule a Learning Session
As a valued member, we encourage you to take advantage of a personalized 30-minute learning session with one of our co-founders. This is your opportunity to get tailored guidance on how to interpret our data and effectively implement our strategies in your own investment approach.
To schedule your session, simply email us at info@fverinvest.com with the subject line: "Learning Session". (Please note: We do not provide specific investment advice.)