
Going Inverse
📰 Monday, May 25, 2026: Welcome to the FVEr Invest Blog: Your Guide to Data-Driven Market Analysis
Hello FVEr Invest Subscribers!
Thank you to our new and continuing subscribers for your support of our platform. Our goal is to bring you frequent market insights, using our proprietary FVE algorithm to help you gain a clearer understanding of market dynamics.
Disclaimer: The FVEr Invest blog and website should not be construed as specific investment advice, and our approach is not suitable for everyone. It is intended to demonstrate what our algorithmic strategy is doing each week, with insight into how we are thinking about the stock markets, and how we approach investing through a data driven lens. Investing involves risk, and our models are inherently uncertain. Please consult a professional and licensed investment advisor for investment advice.
It's been an eventful few weeks since our last update, with the market navigating a complex cocktail of rising Treasury yields, AI earnings enthusiasm, and persistent geopolitical noise from the Iran conflict.
In our 2026 Market Outlook in January we made the following prediction about the S&P 500 at year end:
“Our price target, which is in line with Bank of America and Ned Davis Research, is the third lowest, near the 7100 mark. As we have said recently, our model believes the US large cap stock market is expensive right now. If the S&P 500 hits the highest price target of $8,100 by Oppenheimer, that would put the index around 14% above the FVE by year end, which is in the 1 star range almost 2 standard deviations above the FVE. We think this scenario is unlikely, unless there is an AI driven investment frenzy that causes temporary price appreciation similar to the dot com boom then bust era. Currently, that does not seem to be happening after a cooling off period in the AI names in the fourth quarter.
Anything in the range 6800 to 7400 is what our model would deem fairly valued at year end 2026. Thus, we think most investment firms are considerably over optimistic going into 2026.”
Since that post, we have seen signs of overheating in the AI trade, particularly in the semiconductor and AI infrastructure space, which has pushed the overall index to record highs. Interestingly, if you look at our dashboard, many sectors are hovering in the three star range near fair value, but the XLK (Technology) and SOXX (Semiconductors) sectors have risen astronomically in the last month, creating a very concentrated area of market winners, which is concerning.
It is easy to feel the FOMO (Fear Of Missing Out) when momentum driving tech names seems unstoppable. However, our data suggests that the risk-to-reward ratio at current record highs is heavily skewed to the downside for long-term investors.
The SPY closed on Friday in 1 star territory. While there have been intra-week moments when SPY has ventured into 1 star territory in recent months, this is the first Friday close in 1 star territory since late December 2021, almost 4.5 years ago. This highlights how overextended the market has become.
Here's what we're watching and how the FVEr strategy is positioned.
The Macro Picture: Yields in the Driver's Seat
The dominant story of the past three weeks has been the bond market. The 10-year U.S. Treasury yield finished the week at around 4.56%, while the long end of the curve moved even more dramatically. The 30-year yield briefly touched 5.2% on May 19, its highest level since 2007. Oil prices remained well above pre-conflict levels (WTI ended Friday near $96/bbl) amid ongoing supply disruptions tied to the Middle East conflict, and investors continued to scale back expectations for Federal Reserve rate cuts. That yield surge put real pressure on equities mid-week. On May 19, the S&P 500 fell 0.67% to 7,353.61, the Nasdaq slid 0.84% to 25,870.71, and the Dow lost 0.65% to close at 49,363.88.
By week's end, however, the bulls reasserted themselves. The Dow Jones closed Friday at 50,579.70, gaining 294 points (0.58%) to a fresh record high, with gains led by Merck (+5.64%), Salesforce (+2.23%), and Cisco Systems (+2.01%). The S&P 500 rose 0.37% to 7,473.47, which is up roughly 5.1% over the trailing month and up about 29% year-over-year, marking its eighth consecutive weekly gain, the longest such streak since December 2023.
Semiconductors and Tech: The Model Stays Bearish
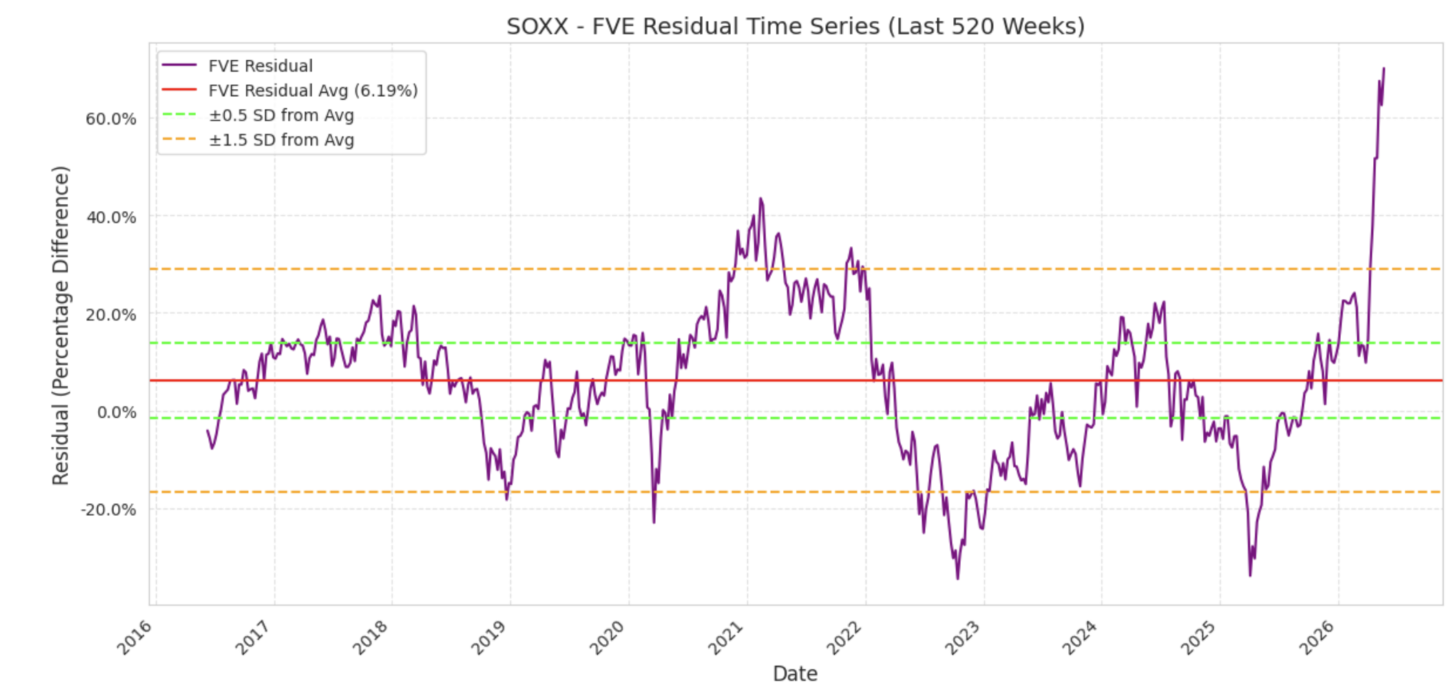
SOXX has been in inverse status for about a month, and it will remain that way for the foreseeable future. This positioning has been stress-tested in a big way. SOXX closed at $537.33 on May 22, with a year-to-date NAV total return of 74.52% as of May 21. Semiconductors have been one of the strongest performing corners of the market in 2026, driven in large part by AI infrastructure spending.
Despite the run, the FVE algorithm has not flipped. SOXX remains in inverse status, and broader tech (XLK) is also in inverse status. Chasing a 74% YTD mover with leverage is exactly the kind of emotional decision our model is designed to protect against, and the algorithm is, if anything, doubling down on its caution. We don't always love what the model tells us, but the entire point of running a systematic strategy is to let the process do its work, especially when momentum looks irresistible.
Eventually, the statistical framework reasserts itself, and SOXX will normalize and fall back to lower levels. SOXX is currently registering nearly 70% above its historical FVE. No matter how strong the analysts promote the AI buildout, this is an extreme reading.
Healthcare: Signs of a Comeback
XLV remains in leveraged status (we are positioned in RXL on the 2x sleeve and CURE on the 3x sleeve), and we believe the fundamental backdrop supports continued patience here. Biotech M&A activity is picking up, pharma deals are being struck, and much of the earlier worry about tariffs and interest rates has faded in the healthcare sector. Healthcare led S&P 500 sector gains on Friday with a +1.19% advance.
The Bigger Picture: AI, Valuations, and What Comes Next
There's a real tension building in this market that we think deserves attention. According to FactSet's May 8 Earnings Insight, the S&P 500 is projected to deliver about 21.0% year-over-year earnings growth for full-year 2026, with the Information Technology sector leading all sectors on both earnings and revenue growth. In Q1 2026, the tech sector's blended revenue growth came in at roughly 29.8%, making it among the most robust in the index, and tech is one of five sectors expected to post double-digit earnings growth for the full year. Earnings have broadly delivered.
But valuation is becoming harder to ignore. The forward 12-month price-to-earnings ratio for the S&P 500 stood at 20.9 in late April, above both the five-year average of 19.9 and the ten-year average of 18.9. As of May 8, it had nudged up to 21.0.
Despite a Middle East conflict that has severely disrupted global energy supplies, stocks have vaulted to record highs. If investors continue to look past the Iran conflict and focus on earnings growth, the market could potentially ride the AI boom's tail to new highs in the second half, which we think would be speculative, leading to a potential major market crash.
Our base case is that the market moderates from here and pulls back 5-10% into the end of the year, in line with our FVE. An extended energy supply crunch and the inflation pressure it brings to the long end of the curve is the key risk that could be a catalyst for this correction.
📈 FVEr Weekly Market Update: May 25, 2026
At the sector level, the leveraged positions sit in healthcare (XLV), materials (XLB). The inverse positions are concentrated in tech (XLK), and semiconductors (SOXX), where the algorithm continues to flag stretched momentum despite, or perhaps because of, the YTD run.
At the market level, SPY and IWM have both moved into inverse status, putting a third of broad market exposure now inversely positioned. This is the first week SPY has been in inverse status since January 7, 2021. It is a rare occurrence.
We are comfortable with this positioning given the mixed signals between strong earnings and rising rate/inflation pressure. As always, we believe that if we run this strategy consistently and let the probabilities play out, the long-term results speak for themselves. Stay patient, and stay disciplined.
See you next time. In the meantime, please don't hesitate to reach out if you have any questions.
The FVEr Team
Unlock Deeper Insights: Schedule a Learning Session
As a valued member, we encourage you to take advantage of a personalized 30-minute learning session with one of our co-founders. This is your opportunity to get tailored guidance on how to interpret our data and effectively implement our strategies in your own investment approach.
To schedule your session, simply email us at info@fverinvest.com with the subject line: "Learning Session". (Please note: We do not provide specific investment advice.)
