
The Consumer Price Index (CPI)
📰 Monday, February 2, 2026
Welcome to the FVEr Invest Blog: Your Guide to Data-Driven Market Analysis
Hello FVEr Invest Subscribers!
Thank you to our new and continuing subscribers for your support of our platform. Our goal is to bring you frequent market insights, using our proprietary FVE algorithm to help you gain a clearer understanding of market dynamics.
Disclaimer: The FVEr Invest blog and website should not be construed as specific investment advice, and our approach is not suitable for everyone. It is intended to demonstrate what our algorithmic strategy is doing each week, with insight into how we are thinking about the stock markets, and how we approach investing through a data driven lens. Investing involves risk, and our models are inherently uncertain. Please consult a professional and licensed investment advisor for investment advice.
Applying the FVE to the Consumer Price Index
For over a decade between the Great Financial Crisis (2008) and the COVID-19 pandemic (2020), the Consumer Price Index (CPI) was a benign afterthought for most market observers, doing little to move the needle after its monthly release. During these years, the US economy saw persistently low inflation, allowing the Federal Reserve to focus almost exclusively on stimulating growth, which included maintaining low borrowing rates and purchasing treasuries to bolster demand (quantitative easing). These policies fueled a historic bull run in equity markets. For investors like myself, who came of age and began investing in earnest during this period, the CPI’s true significance only became clear in 2022. It became the star of the show overnight, determining the fate of the market from one month to the next. Driven by supply chain bottlenecks, labor market upheavals, and massive government stimulus, inflation (as measured by the CPI) surged in mid-2021. This emerged as the central concern for the Fed, ending the era of “easy money” and sending the S&P 500 into a punishing bear market.
Arguably, one of the first signs of concern occurred in the economically sensitive small caps index, Russell 2000, which went on a torrid run during the second half of 2020 and 2021 due to near zero interest rates, peaking in November 2021, and then beginning a multi year decline that bottomed out two years later in October 2023 – one of the worst stretches for a broad market index in recent history. Two months later in January 2022, the large cap index, S&P 500, followed suit, and began its bear market.
The CPI is a statistical measure produced by the Bureau of Labor Statistics that tracks the prices paid by consumers for various goods and services from different categories such as housing, food, transportation, medical care, apparel, etc. The CPI serves as a monthly barometer of price stability. By measuring the current index against its level from twelve months prior, the Year-over-Year (YoY) calculation filters out seasonal volatility and monthly anomalies. This change is expressed as a percentage, providing a standardized growth rate that allows investors to track the rate of inflation against the Fed’s targets. If you are familiar with concepts of calculus, it is representative of a first derivative.
It is a common misconception that "easing" inflation implies that prices are falling. In reality, it simply means the YoY value is decreasing—the "derivative" is shrinking, leading to a concave down pattern where the CPI curve begins to level out. Prices are still higher than they were, but the speed at which they are climbing has decelerated.
The CPI is one of the most natural exponential growth phenomena in the world around us. Part of this is engineered by consistent and reliable Federal Reserve policy, and some of this is likely due to inherent axiomatic features of economics. Indeed, tracking the CPI is something our FVE algorithm is well positioned to do, and we can determine where inflation should be based on many years of CPI data.
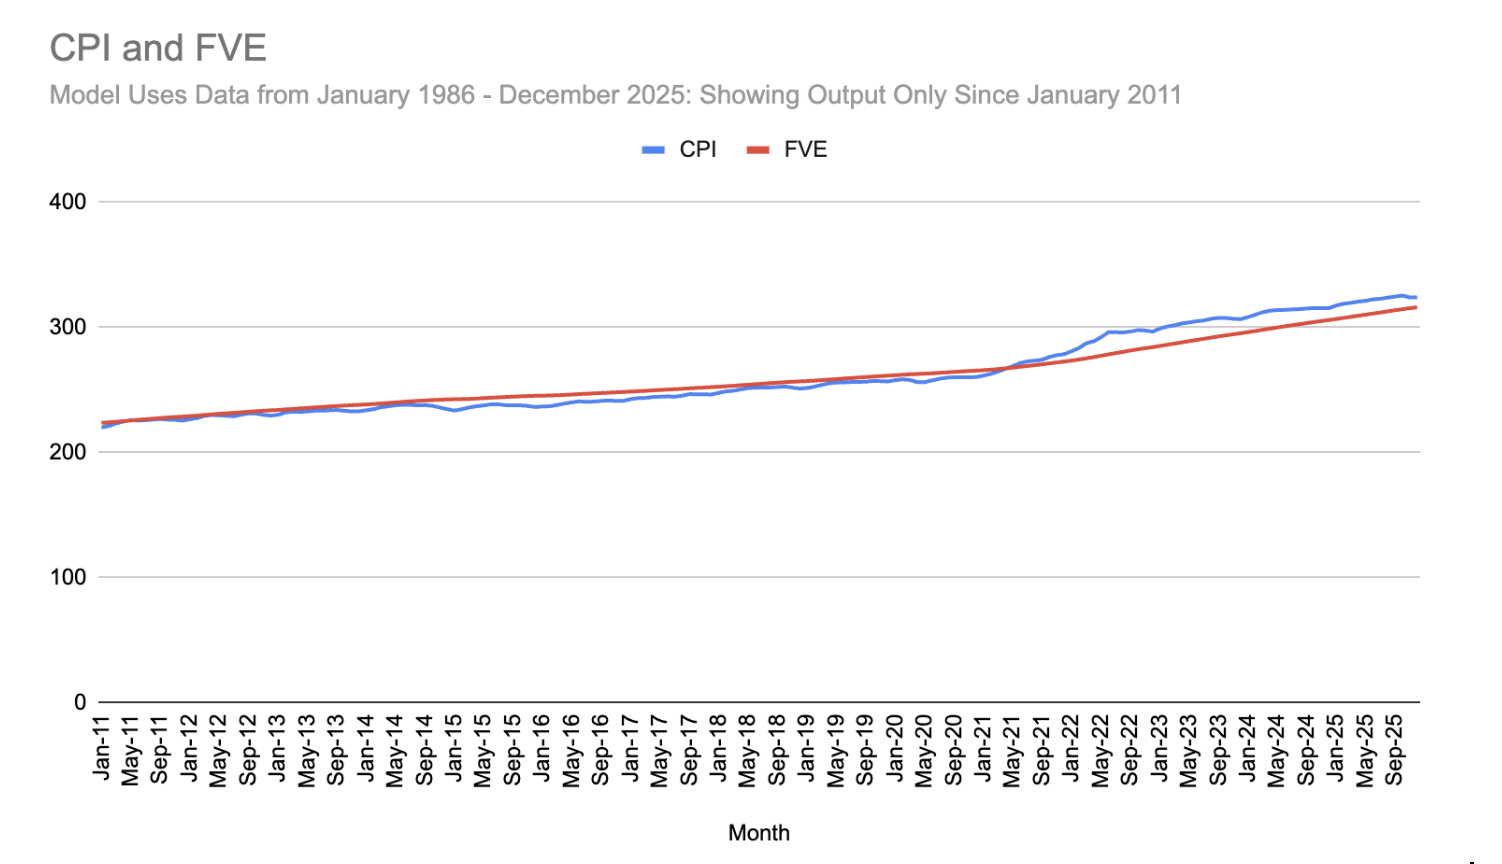
For the below study, we used CPI data between January 1986 and December 2025, or about 40 years of historical CPI prints. The CPI is a monthly data point, which is much more discrete than the weekly data we use for our ETF modeling, and thus this is why we doubled the length of historical data. We are showing charts which output only the last 15 years of the model, even though the model is rooted in data starting in 1986.
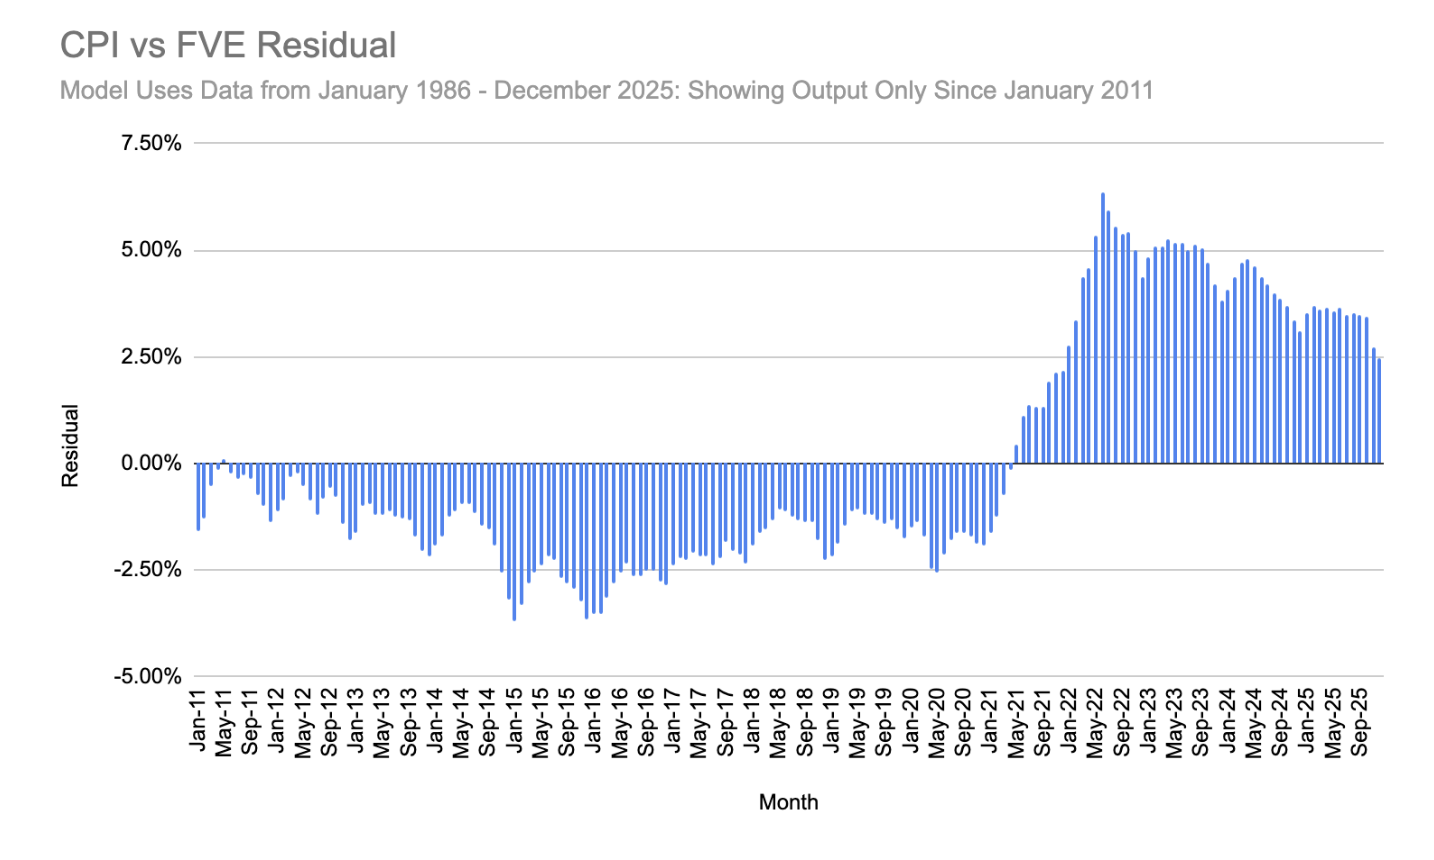
In the below graphics, you can see CPI plotted against the FVE. Between 2011, and mid 2021, the CPI tracked under the FVE indicating a depressed inflationary period which we discussed above. Since that time, the CPI jumped above the FVE, and the peak residual (percent difference between the CPI and FVE) of 6.35% occurred in June 2022. This corresponded to a month which saw an 8.39% decline for the S&P 500, as investors chaotically processed what appeared to be runaway inflation.
The below graphic shows a YoY comparison of the FVE versus the CPI. The takeaway from this study is that the CPI continues to be elevated relative to the FVE, which represents where we think the CPI “should” be, but the CPI appears to be on a trajectory to re-intersect the FVE in the next year. In other words, we think the current monetary policy stance of maintaining the current interest rate seems like the appropriate choice, and we don’t see a compelling reason to cut rates further which could reignite inflation.
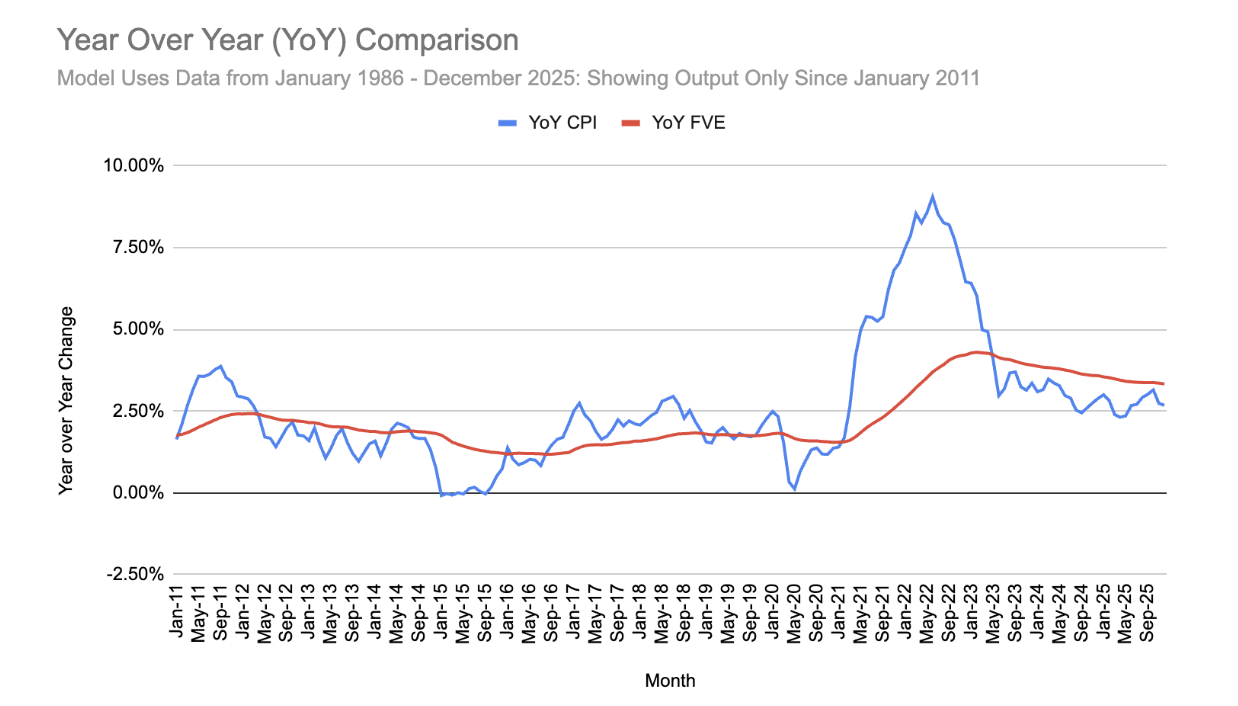
The consensus market view is for additional rate cuts later in the year, and our model would lean against those. Rate cuts act as an accelerant for equity prices. Because we believe those cuts may not materialize as quickly as the market hopes, this supports our model’s view of a more muted 2026 outlook, compared to other market analysts.
📈 FVEr Weekly Market Update: February 2, 2026
Despite major indices being near record highs, there are a number of destabilizing factors that are weighing on the outlook in the last couple of weeks: commodity bubbles / bursts (gold and silver), uncertainty about the path of the Fed with the recent appointment of the yet to be confirmed Kevin Warsh, the potential undermining of Fed independence, the accelerating view of job displacements due to AI, the declines of software as a service stocks due to the threat of AI (Salesforce, Adobe, ServiceNow, etc), the boom of digital memory and storage stocks (Micron, Sandisk, Western Digital), as the latest permutation of the AI trade, and worries about over-investment in the AI buildout.
This has put pressure on the tech sector, with XLK (SPDR S&P Technology) selling off just enough to nudge it into leverage status, led to the downside by a 10% decline in MSFT (Microsoft) post earnings.
Weakness in the financial sector year to date has pushed XLF into leverage status as well.
Thus far, our 2026 outlook on XLE (SPDR S&P Energy) has been off the mark, with the sector rising 14.8% year to date. Our view was negative coming into the year. However, we have much lower conviction in our model applied to a commodity setting like XLE, as we have mentioned previously.
See you next time. In the meantime, please don't hesitate to reach out if you have any questions.
The FVEr Team
Unlock Deeper Insights: Schedule a Learning Session
As a valued member, we encourage you to take advantage of a personalized 30-minute learning session with one of our co-founders. This is your opportunity to get tailored guidance on how to interpret our data and effectively implement our strategies in your own investment approach.
To schedule your session, simply email us at info@fverinvest.com with the subject line: "Learning Session". (Please note: We do not provide specific investment advice.)